
Puget Sound · Washington
Is Edmonds Safe? Crime Rates, Safest Neighborhoods & Local Reality (2026)
Edmonds has a reputation that often surprises people who've done their homework. It photographs beautifully — ferry dock, waterfront parks, boutique downtown — and the median household income of $122,449 signals a community that's established and invested. But the crime picture is more layered than the aesthetics suggest, and buyers who assume "nice-looking waterfront suburb" automatically means "low crime" can walk into their purchase without the full story.
What the numbers actually reflect is a city where violent crime runs below both state and national averages, but property crime lands noticeably higher than the national baseline. That split matters enormously in daily life. Violent crime here is genuinely low — you're significantly less likely to be a victim than in most Washington cities. Property crime is the real variable, and it clusters predictably around retail corridors and high-traffic areas rather than spreading evenly across the city's residential neighborhoods.
This guide breaks down what the crime data actually means, which neighborhoods carry the lightest footprint, where the activity concentrates, and how Edmonds stacks up against Lynnwood, Shoreline, and its other neighbors. If you're relocating here and trying to separate the marketing gloss from ground truth, this is the read you need first.
FBI crime data for 2024 puts Edmonds's total crime rate at roughly 3,261 per 100,000 residents — about 17% above Washington's state average and 54% above the national figure. Those top-line numbers sound alarming until you pull them apart. The total rate is driven almost entirely by property crime; the violent crime rate, at approximately 260 per 100,000, runs about 27% below the national rate and 20% below the state average. That's not a rounding error — it's a meaningful structural difference between a city with periodic car break-ins and a city where personal safety is genuinely at risk.
Third-party rating sites produce wildly divergent grades for Edmonds precisely because they weight these two categories differently. Platforms that lead with total crime or property crime volume assign D grades and bottom-quartile rankings. Platforms that weight violent crime more heavily — which most safety researchers argue is the more meaningful metric for day-to-day quality of life — put Edmonds in the top quartile statewide. The honest answer is that Edmonds sits roughly at the national average for overall crime, slightly below average for violent crime, and above average for property offenses. Understanding that distinction is the starting point for everything else in this guide.
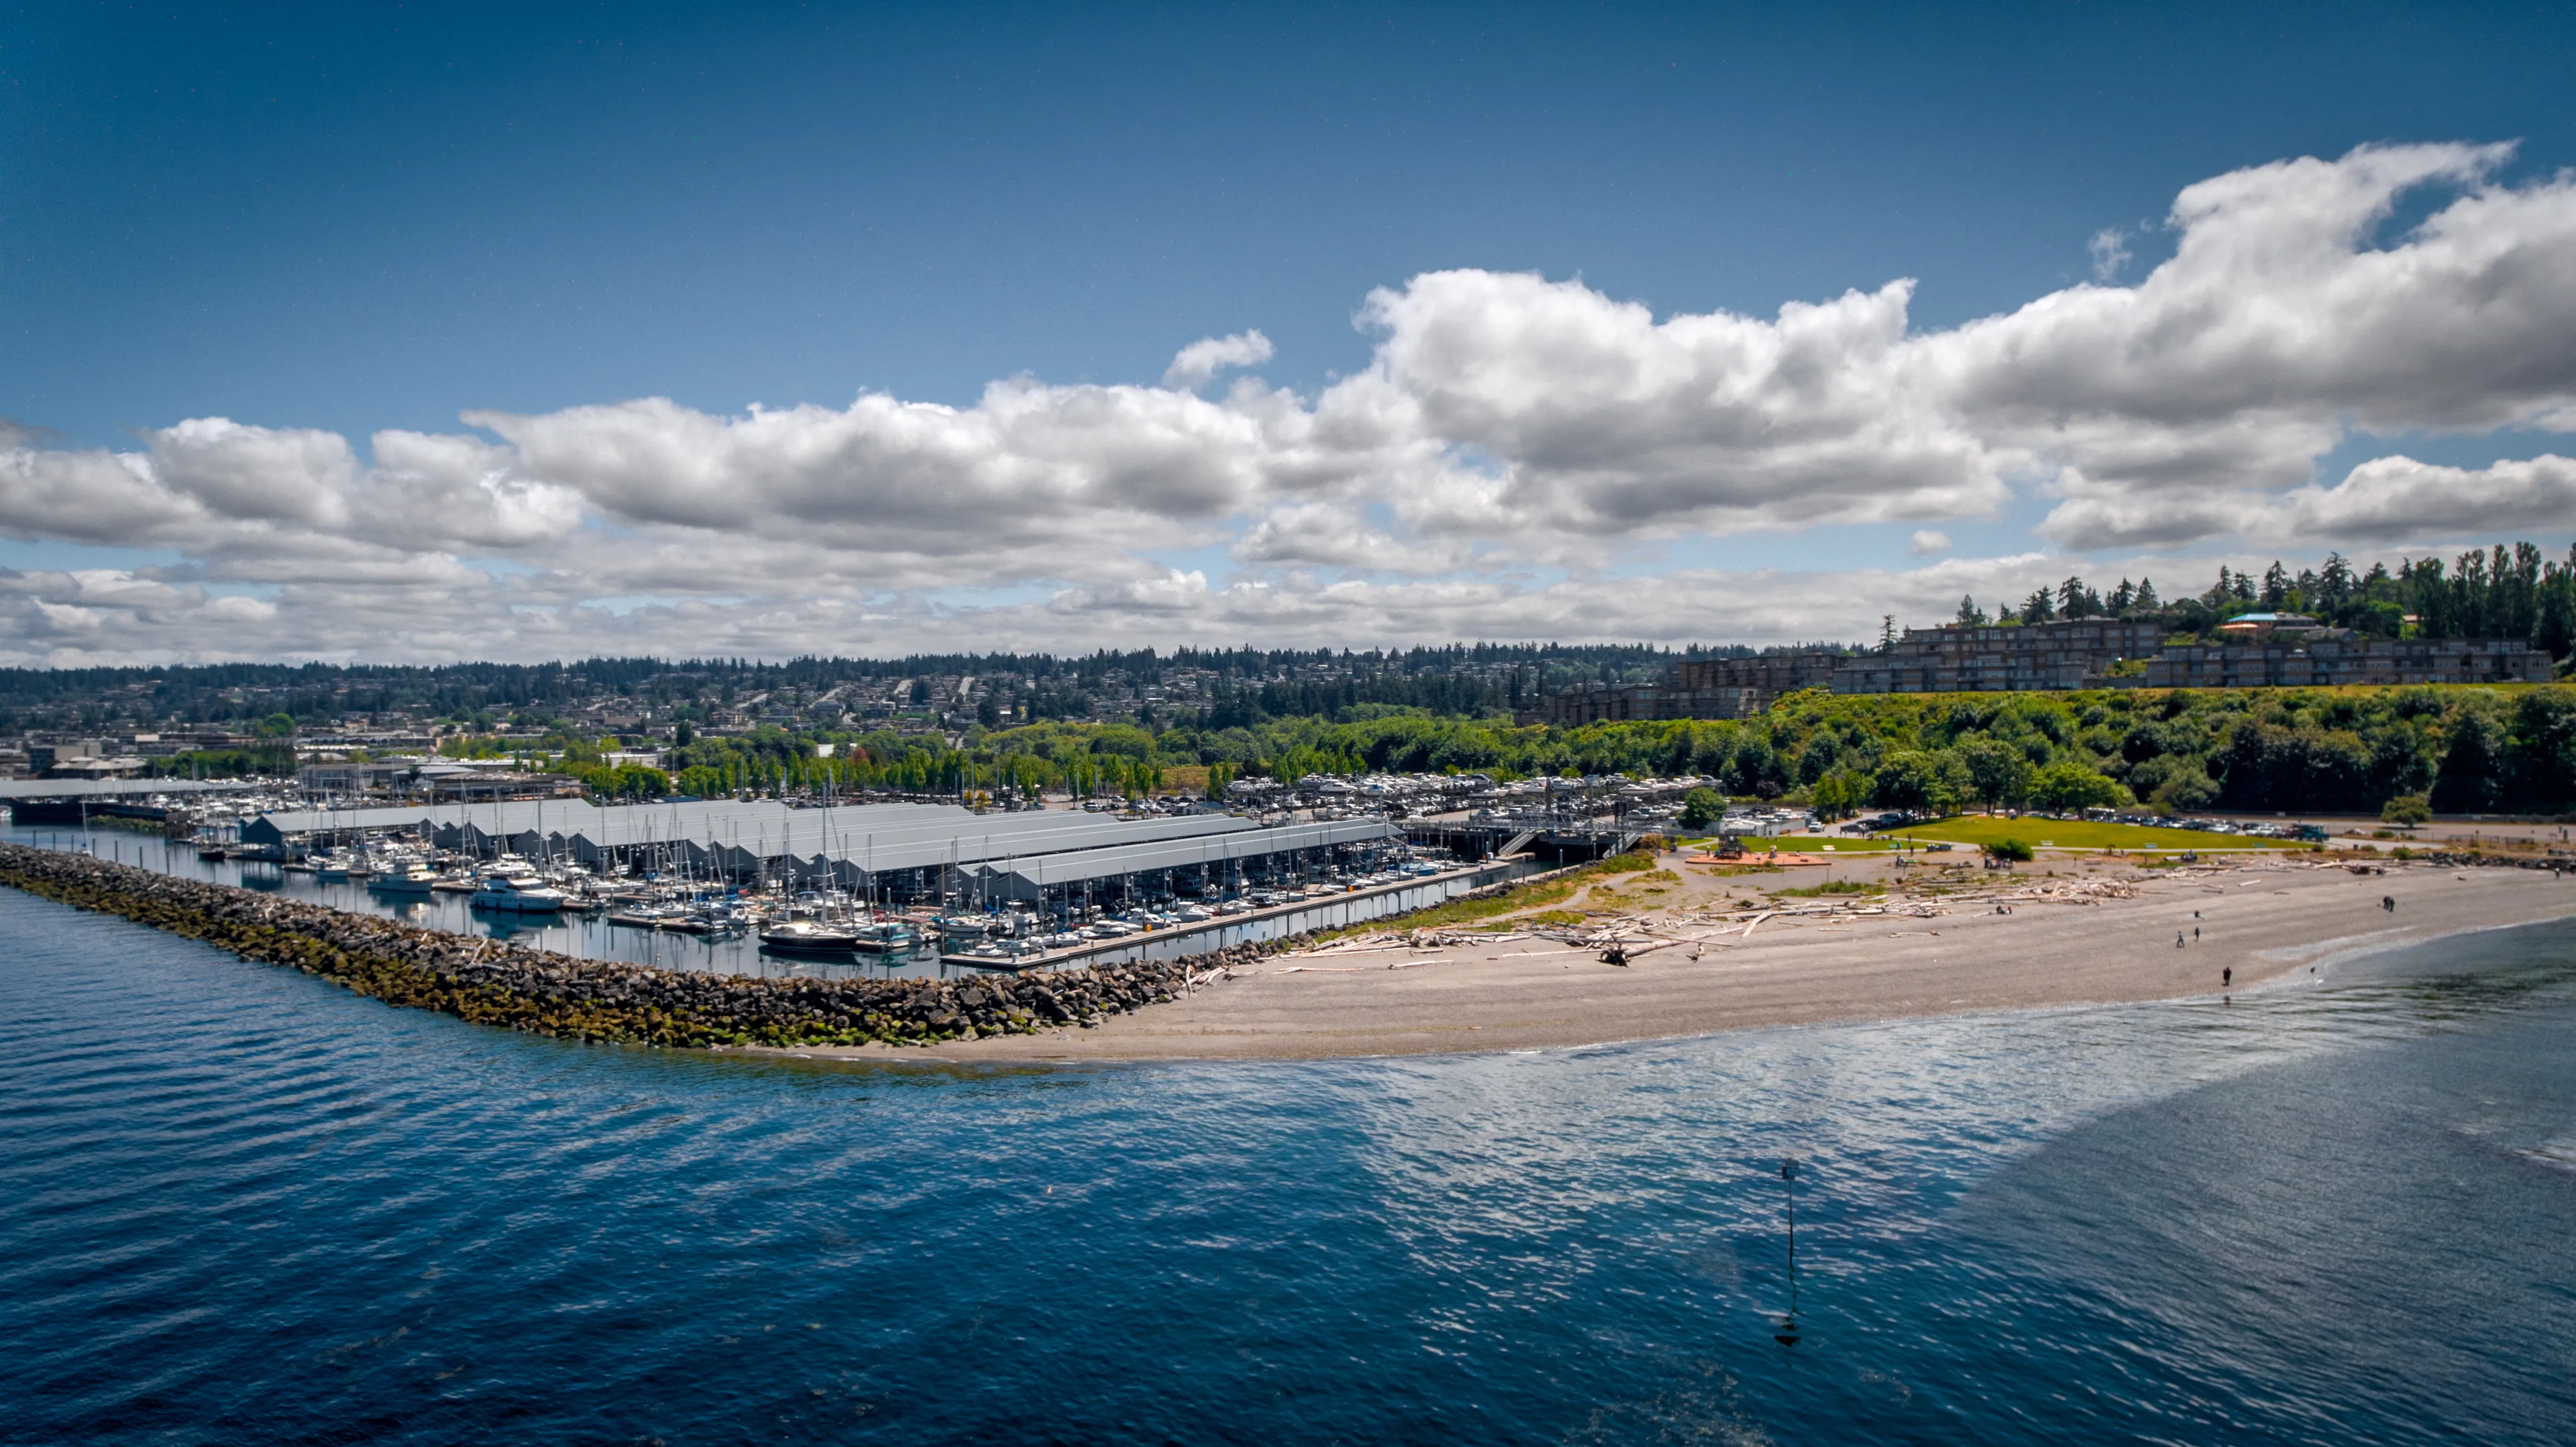
One structural factor that inflates the overall rate is worth naming directly. Edmonds's downtown waterfront, ferry terminal, and commercial corridors attract substantial visitor traffic. When crimes are measured per resident rather than per visitor or per person present, high-traffic commercial areas can appear worse than they functionally are for the people who actually live nearby. The northwest residential neighborhoods, where foot traffic is lower and retail is sparse, record the lowest crime volumes in the city — roughly 20 incidents per year across that entire quadrant.
Local police data for 2024 recorded 111 violent crimes across the city — a rate that, while up year-over-year, still places Edmonds safer than most of its regional peers on the metric that most directly affects personal safety. In practical terms, the 1-in-384 chance of violent victimization here is meaningfully better than the Washington state average. Residents in the northeast neighborhoods specifically face odds closer to 1 in 461. For a city of 42,721 people with a busy waterfront and active nightlife corridor, that figure reflects a community that functions well.
Property crime is where Edmonds earns its asterisk. The 2024 data logged roughly 1,280 property crimes — a rate of about 30 per 1,000 residents that runs 70% above the U.S. average. Vehicle break-ins and theft dominate the category, and they concentrate around the downtown ferry staging area, commercial parking lots along Highway 99, and the Five Corners retail hub. Residential neighborhoods away from these corridors see dramatically less activity. The property crime rate is the primary reason aggregate safety rankings for Edmonds vary so sharply depending on the source.
The Bowl is Edmonds's most iconic address and its most active crime zone — those two facts are inseparable. The density of restaurants, the ferry terminal, Saturday farmers market crowds at the waterfront, and the volume of parked cars near Brackett's Landing Park create the conditions where property crime finds opportunity. Residents here are well aware: locked cars, interior cameras, and garage parking are standard practice, not paranoia. The flip side is that the Bowl's foot traffic and active street life also function as a natural deterrent to more serious crime — violent incidents here are rare relative to the activity level.
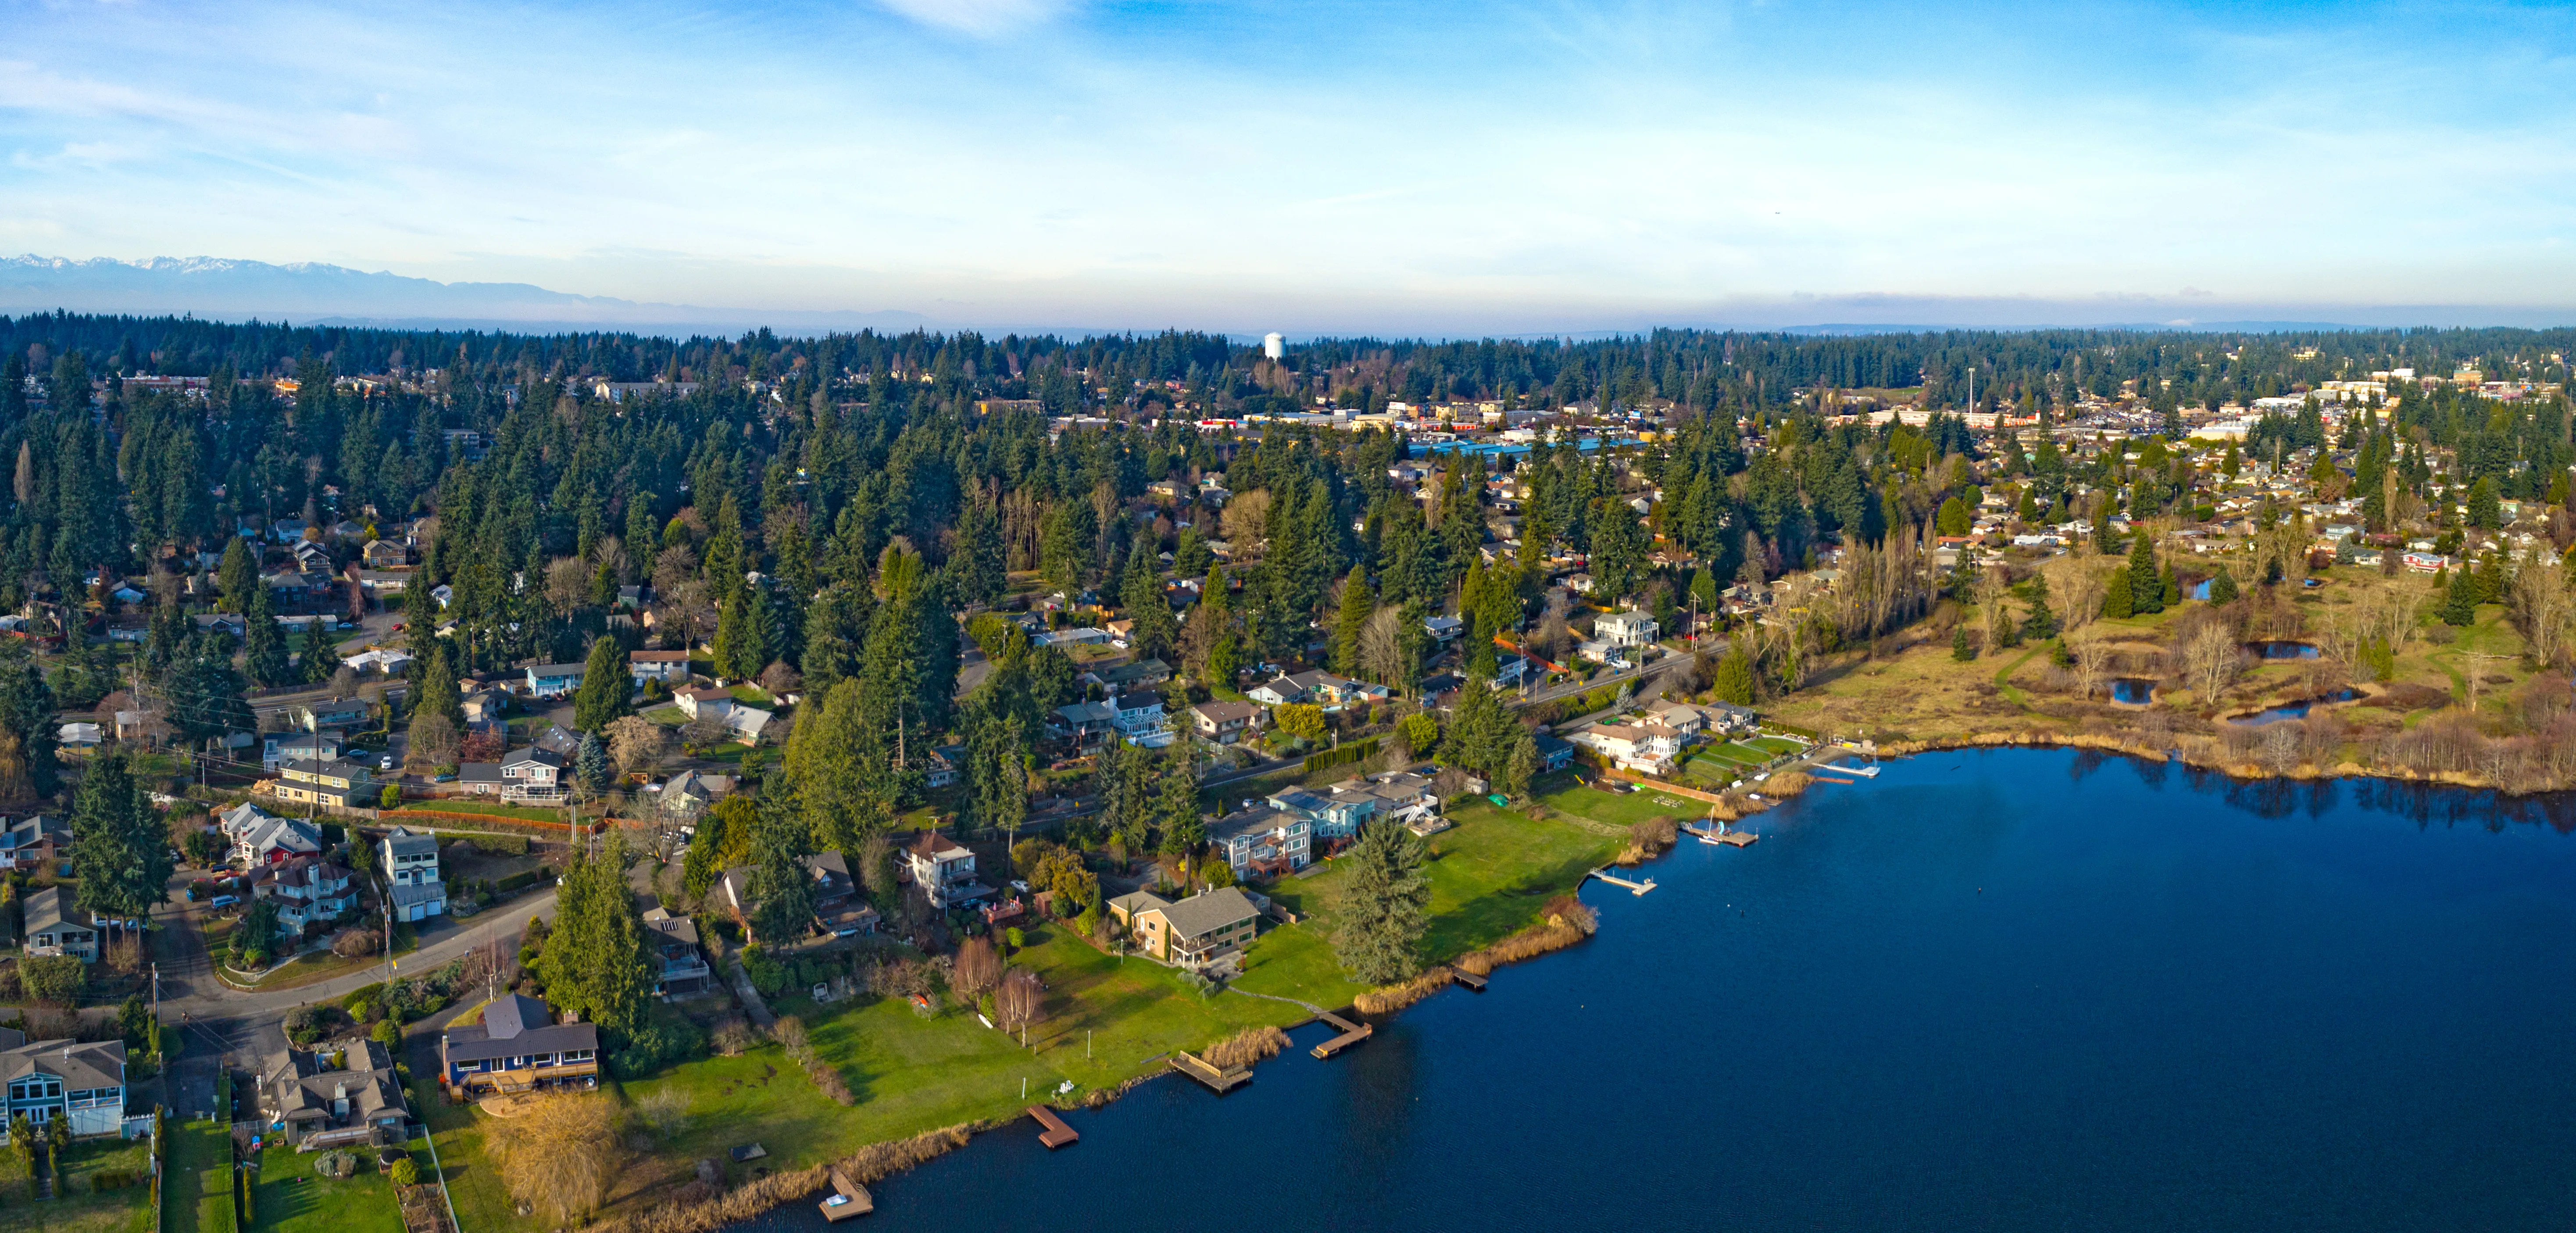
Seaview and the Perrinville corridor, tucked into the northwest hillside above Highway 99, consistently rank among the city's safest residential pockets. Crime research puts this area in the A-range for safety grades, with incident volumes that are among the lowest in any comparable Snohomish County neighborhood. The streetscape here is quiet and residential, well removed from the commercial density that generates most of the city's property crime. Families who price-compare the Bowl with Seaview and choose the hillside often cite the safety profile as a deciding factor alongside the larger lot sizes.
Talbot Park and North Edmonds neighborhoods are where the city's safety-conscious buyers tend to land when they've done their homework. Both areas receive top safety grades in neighborhood-level analysis, reflecting minimal reported incidents and lower victimization odds. These are established, ownership-heavy neighborhoods where the housing stock is well-maintained and street activity is predictably quiet. The northeast quadrant of the city specifically logs some of the best violent crime odds in Edmonds — closer to 1 in 461 — which is a stat that tends to resonate with buyers coming from denser urban environments.
Sherwood Forest sits inland and residential, with the kind of low-traffic street patterns that naturally suppress property crime. The neighborhood's distance from major retail corridors is its biggest safety asset — there simply aren't the opportunity targets that attract the vehicle break-in activity seen closer to downtown or Highway 99. Five Corners, by contrast, is a commercial node, and its retail concentration introduces more incident activity than the purely residential neighborhoods nearby. Buyers drawn to Five Corners for its convenience trade some of the quiet footprint that Sherwood Forest offers a few blocks away.
Meadowdale occupies the northwest edge of the city near the Meadowdale Beach Park access, a neighborhood defined by large lots, significant tree cover, and streets that don't function as through-routes. That physical insularity shows in the crime data — this is one of the city's lower-volume areas for both categories. The neighborhood's distance from both downtown and Highway 99 means it sidesteps the commercial spillover that inflates numbers elsewhere in the city.
Esperance is technically an unincorporated island within Edmonds's boundaries — a quirk of local geography that means it receives Snohomish County Sheriff services rather than the Edmonds Police Department. That distinction matters less to daily safety than some buyers assume, but it does mean EPD response times may differ from city-served neighborhoods. The area is primarily residential and single-family, with a crime profile that reflects its quiet, suburban character. Buyers should simply note the jurisdictional difference when comparing it to fully incorporated neighborhoods.

| City | Violent Crime/1K | Property Crime/1K | Overall Safety Profile |
|---|---|---|---|
| Edmonds | ~2.6 | ~30 | Below-avg violent crime; above-avg property crime |
| Lynnwood | ~5.2 | ~48 | Higher on both metrics; significant commercial density |
| Shoreline | ~2.8 | ~26 | Comparable violent crime; slightly lower property crime |
| Mountlake Terrace | ~3.1 | ~29 | Near parity with Edmonds overall |
| Mukilteo | ~1.4 | ~18 | Among the lowest in the region on both metrics |
| Woodway | ~0.5 | ~8 | Extremely low; small, affluent, residential-only city |
| Seattle | ~6.8 | ~52 | Significantly higher across all categories |

When buyers start researching safety in Edmonds, they quickly realize that neighborhood choice has a real impact on what they'll pay — and how well their investment holds up over time. Areas like Seaview and Sherwood Forest consistently draw strong buyer interest, and homes there tend to move fast, sometimes within days of hitting the market. Meadowdale also attracts attention for its quieter residential feel. If you're targeting something under $750,000 in these pockets, expect competition and limited time to think it over.
That's exactly why I always encourage buyers to connect with a lender before they start touring homes. Knowing your full monthly payment — including property taxes, homeowner's insurance, any HOA dues, and how your loan is structured — gives you a much clearer picture than a purchase price alone. There's also a real difference between what you're approved for and what you're actually comfortable paying every month. When the right home in a neighborhood like Downtown Edmonds or Westgate appears, you want to be ready to move with confidence, not scrambling to figure out your numbers.
The Highway 99 corridor — the section running through the eastern edge of Edmonds, sometimes called the International District area — operates at a fundamentally different safety level than the Bowl or the hillside neighborhoods. Locals avoid leaving anything visible in parked cars along this strip, and the commercial character of the corridor, with its motels and auto-oriented retail, creates the conditions for the kinds of incidents that push Edmonds's aggregate property crime numbers upward. Buyers looking at homes adjacent to this stretch should factor in that they're in a different micro-environment than the Edmonds that gets photographed for real estate brochures.
What the apps miss is the role that community infrastructure plays in managing the crime picture. The Edmonds Police Department, now under Chief Loi Dawkins — appointed in July 2025 and bringing over 23 years of law enforcement experience including work with King County Sheriff and the Metro Transit Police — operates with 62 officers across a 42,000-person city. That staffing level is adequate for Edmonds's actual incident volume, and the department runs community-facing programs that maintain the neighborhood communication channels Nextdoor alone doesn't replicate. The five registered sex offenders citywide as of early 2026 reflect a ratio of roughly 8,500 residents per registrant — a figure that tends to reassure families more than any abstract grade from an aggregator site.
What longtime residents actually do: they lock cars in the Bowl regardless of how short the errand, they use Ring or Nest cameras as a standard feature of homeownership, and they treat the downtown waterfront at night the way most urban-adjacent residents treat any busy mixed-use district — aware but not anxious. That's the practical reality of living in a city where the lifestyle is exceptional and the property crime profile requires ordinary urban-living habits. Buyers coming from genuinely high-crime environments often find Edmonds's reality considerably more comfortable than its aggregate scores suggested.
Local Expert Takeaway: If safety is your deciding factor, focus your search in the northwest and northeast residential neighborhoods — Seaview, Perrinville, Talbot Park, and Meadowdale consistently record the city's lightest crime footprints. Avoid dismissing Edmonds based on aggregate scores alone; those numbers are heavily influenced by the downtown/ferry corridor and Highway 99 commercial strip, not the residential neighborhoods where most buyers end up. A home in Sherwood Forest or North Edmonds sits in a genuinely different crime environment than the same address would suggest on a city-wide heat map.
✅ Edmonds's violent crime rate runs below both state and national averages — the city is meaningfully safer than most Washington cities on the metric that matters most to personal safety.
⚠️ Property crime — primarily vehicle break-ins and theft — runs above the national average and concentrates around the downtown waterfront, ferry staging area, and the Highway 99 commercial corridor rather than spreading evenly through residential neighborhoods.
📍 The safest residential pockets are in the northwest and northeast — Seaview, Perrinville, Talbot Park, North Edmonds, and Meadowdale consistently record the lowest incident volumes in the city.
Is Edmonds a safe place to live?
For daily personal safety, yes — Edmonds's violent crime rate runs roughly 27% below the national average, which is a meaningful margin for a waterfront city with active commercial and tourist corridors. Property crime is the genuine caveat, running above average citywide, though it clusters predictably around retail and high-traffic areas rather than across residential neighborhoods uniformly.
Which neighborhoods in Edmonds have the lowest crime?
Talbot Park, North Edmonds, Seaview, Perrinville, and Meadowdale consistently show the city's lowest crime volumes in neighborhood-level analysis. The northwest and northeast quadrants of the city carry the best safety profiles, reflecting their residential character, distance from commercial corridors, and homeownership-heavy demographics.
How does Edmonds compare to nearby cities for safety?
Edmonds sits in the middle of the regional pack — safer than Lynnwood and Seattle on both violent and property crime metrics, roughly comparable to Mountlake Terrace and Shoreline, and behind Mukilteo and Woodway, which are among the lowest-crime cities in Snohomish County. For buyers choosing between Edmonds and its immediate neighbors, the safety gap is most significant when comparing to Lynnwood, where both metrics run noticeably higher.
Explore the full Edmonds series: The Ultimate Edmonds Relocation Guide · Is Edmonds Safe? · Cost of Living in Edmonds · Best Neighborhoods in Edmonds · Edmonds Schools & Family Life · Edmonds Youth Sports · Edmonds Parks & Recreation · Retiring in Edmonds · 1031 Tax-Deferred Exchange in Edmonds · Edmonds First-Time Homebuyers Guide · Edmonds Down Payment Assistance Guide · Moving to Edmonds from California