
Puget Sound · Washington
Snohomish doesn't have a crime problem so much as it has a crime profile — and those are very different things. Violent crime here runs well below the national average, and the city has recorded zero murders in its most recent reported year. Property crime is the more honest conversation, running about 39% above the U.S. average by some measures. That's not unusual for a small city with a historic commercial district that draws significant visitor traffic, but it's worth understanding before you sign a lease or make an offer.
In daily life, what that breakdown means is this: walking through Downtown Snohomish on a Saturday afternoon feels nothing like the crime statistics might suggest. The concern isn't personal safety on the street — it's a car break-in near the antique shops, or a package taken off a porch on a rural road. Local police data suggests that the city averages roughly one crime incident per five and a half hours, but the majority of those incidents are property-related and clustered in the commercial core, not spread evenly across every residential neighborhood.
This guide will walk you through what the numbers actually mean, where in Snohomish you're most and least likely to encounter any type of crime, how the city compares to its neighbors, and what residents actually do differently because of it. If you're relocating here — or trying to choose between Snohomish and a nearby alternative — this is the context the apps and crime maps don't give you.

FBI estimates for 2024 place Snohomish's violent crime rate at roughly 2.6 per 1,000 residents — about 44% below the national average and nearly half of Washington state's average for comparable cities. That's a meaningful gap. The city's overall crime index, commonly reported around 131 on the City-Data scale, sits well below the U.S. benchmark of 235. Perhaps more tellingly, Snohomish saw a 16% drop in total crime from 2023 to 2024, continuing a downward trend that local police data suggests has held for the better part of five years.
Property crime is where the picture shifts. Local police data suggests a rate of approximately 16 per 1,000 — elevated compared to the national average, though not unusual for a city with a busy commercial downtown, active tourism, and several highway-adjacent retail zones. The structural drivers here are worth understanding: Snohomish's historic district pulls thousands of out-of-town visitors on weekends, the Highway 2 corridor brings transient traffic through regularly, and a relatively small police footprint — 16 sworn officers contracted through the Snohomish County Sheriff's Office — is covering a city that swells to roughly 15,000 people on a busy daytime. Those factors elevate the per-capita rate in ways that don't necessarily reflect what residential neighborhoods feel like.
The cost of crime is another useful lens. The projected annual cost per resident in Snohomish runs approximately $353 — about $111 less than the national average and $258 less than the Washington state average. That's a bottom-line figure that tells a different story than the CrimeGrade.org letter grade many buyers first encounter. The C− from that platform reflects a national percentile comparison that doesn't account for the structural difference between a walkable small-city core with retail traffic and a residential neighborhood ten minutes east.
Snohomish reported 21 violent crimes in 2024 — a figure that, adjusted for population, translates to roughly 207 incidents per 100,000 residents. The chance of being a victim of violent crime here sits at approximately 1 in 604. For most residents, this is felt as a near-complete non-issue: Snohomish has the character of a community where people leave doors unlocked in the outlying neighborhoods, where kids bike to school, and where the local police chief is someone you might recognize at the farmers market. The zero-murder rate in the most recent reporting year isn't an anomaly — it fits the overall pattern.
Motor vehicle theft, larceny, and occasional burglary make up the bulk of property incidents, with larceny-theft the most common category by a wide margin. Crime clusters most visibly in the central commercial corridor — particularly around the First Street antique district and the Highway 2 interchange areas — where visitor volume and retail density create the conditions that drive these numbers up. Residential neighborhoods, especially east of the commercial core, see far fewer incidents. Local police data suggests that the east side of Snohomish records roughly 88 crimes annually, compared to approximately 396 in the central zone.
Downtown carries the highest concentration of both foot traffic and property crime incidents, but context matters here. The First Street commercial strip — home to antique dealers, restaurants, and weekend events — draws visitors from across the county, and larceny-theft near parked vehicles is the most commonly reported incident type. Residents who live above the shops or in the surrounding blocks take standard urban precautions: don't leave valuables visible in your car, lock your bike. The street itself feels lively and safe in person; the numbers reflect commercial activity more than residential risk.
Best for: Buyers who want walkable access to downtown amenities and can look past a noisier crime stat for an otherwise active, low-threat environment.
The Snohomish Historic District overlaps geographically with Downtown but carries a distinctly different residential character. Homes here — some of the city's oldest Victorian-era properties — fetch a premium well above the citywide median, and the neighborhood attracts buyers specifically for its architectural character and community identity. Crime incidents in the Historic District tend to be opportunistic property crimes tied to the adjacent commercial activity rather than anything residential in nature. The social fabric here is tight; neighbors know each other by name in a way that functions as its own informal deterrent.
Best for: Buyers willing to pay a premium for history, community engagement, and a neighborhood with strong civic identity.
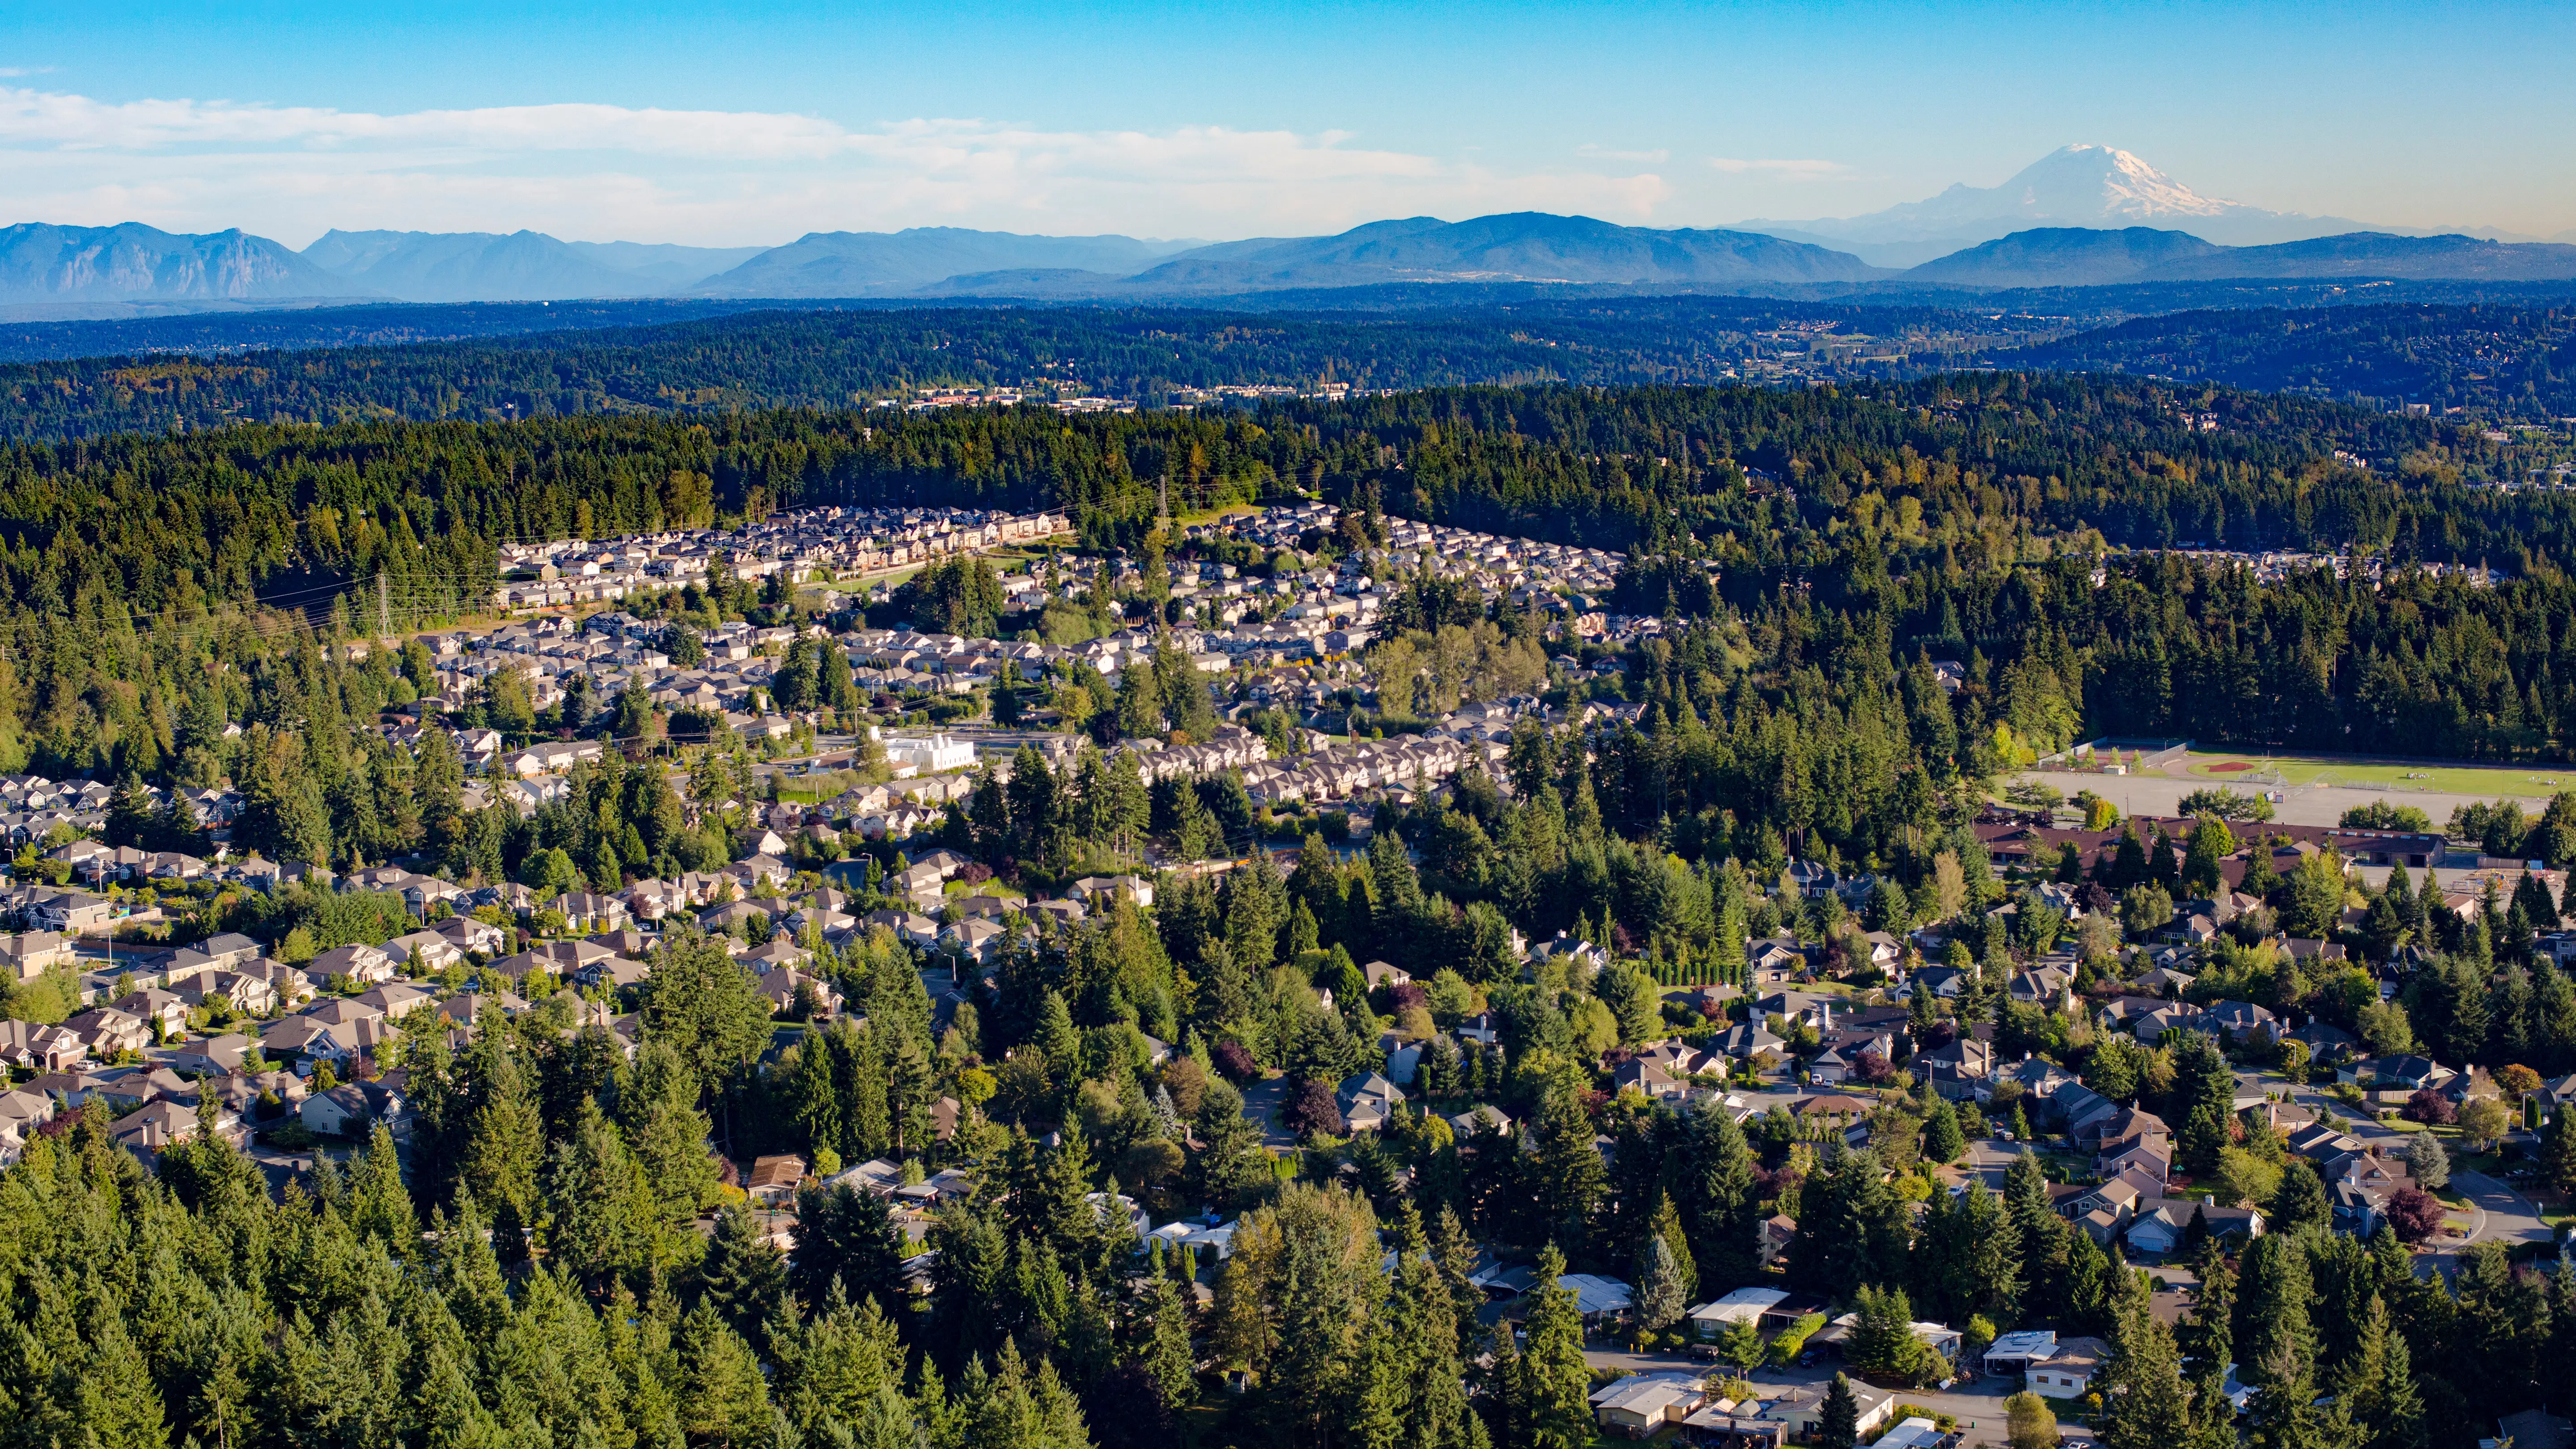
Dutch Hill is routinely cited by long-term residents as one of Snohomish's most peaceful neighborhoods. Situated on elevated terrain with views of the Cascades, the area is predominantly single-family residential with spacious lots, good school access, and a community feel that skews strongly toward established families and long-term owners. High homeownership rates correlate consistently with lower property crime in small cities like Snohomish, and Dutch Hill fits that pattern. Incidents here are genuinely infrequent — the kind of place where a lost dog post on Nextdoor is the main news.
Best for: Families with school-age children looking for a quiet, established neighborhood with mountain views and a strong sense of community.
Lord Hill sits on the southeastern edge of the city's broader area, anchored by Lord Hill Regional Park — a 1,400-acre natural reserve with equestrian trails and dense forest. The neighborhood is semi-rural in character, with a mix of hobby farms, acreage lots, and newer residential development. The east side of Snohomish generally records the fewest crime incidents in the city, and Lord Hill reflects that. The tradeoff is distance from commercial amenities, but for buyers prioritizing privacy and a low-crime residential environment, this corridor consistently delivers both.
Best for: Buyers seeking a rural lifestyle with genuine acreage, low crime density, and proximity to serious outdoor recreation.
Cathcart occupies the southeastern fringe where Snohomish bleeds into unincorporated Snohomish County, and its safety profile trends closer to semi-rural than small-city. Lower population density means fewer incidents in absolute terms, though rural areas do see occasional vehicle prowls on properties with longer driveways or limited sightlines. The community here is tight-knit in the way smaller census-designated places tend to be — neighbors tend to know each other's vehicles, and unusual activity gets noticed. Buyers relocating from denser cities often find the baseline noise level here — both literal and otherwise — to be a significant quality-of-life upgrade.
Best for: Buyers who want semi-rural character, lower crime density, and a community feel without committing to full agricultural acreage.
The Highlands neighborhoods represent some of Snohomish's newer residential development, with a mix of planned subdivisions and established streets pushing toward the city's northern edges. Newer subdivisions tend to benefit from HOA oversight and higher owner-occupancy rates, both of which correlate with lower property crime. Highlands East in particular has developed a reputation among residents for being exceptionally quiet — crime incidents in these zones are limited, and the neighborhood's layout, with fewer cut-through streets, reduces the transient traffic that drives opportunistic theft elsewhere in the city.
Best for: Buyers wanting newer construction in a low-crime setting with good school proximity and a tidy, managed neighborhood environment.
Looking to buy in Estimate your payment.
Enter your numbers to see an estimated monthly mortgage payment.
Estimate only. Excludes HOA fees and mortgage insurance.
| City | Violent Crime / 1K | Property Crime / 1K | Overall Safety Profile |
|---|---|---|---|
| Snohomish | ~2.6 | ~16 | Below-avg violent crime; above-avg property crime |
| Everett | ~5.8 | ~42 | Significantly higher on both measures; urban density |
| Monroe | ~3.1 | ~22 | Slightly elevated vs. Snohomish; more commercial corridor crime |
| Lake Stevens | ~1.9 | ~12 | Slightly safer on property crime; comparable violent crime |
| Mill Creek | ~1.2 | ~11 | Among the safer mid-size suburbs in Snohomish County |
| Maltby | ~1.5 | ~9 | Unincorporated, lower density; favorable profile |
The thing the crime apps don't tell you is that First Street and the Highway 2 interchange are doing a lot of heavy lifting in Snohomish's property crime numbers. Locals who live even half a mile away from those corridors describe their daily experience as something closer to a rural suburb than a city with an above-average crime rate. Vehicle prowls near the downtown parking areas happen, particularly during weekend antique markets and evening dining hours. The practical local response is simple: don't leave anything visible in your car when you park near the First Street shops, and don't leave your truck unlocked in a rural driveway overnight.
What most transplants discover after six months here is that the neighborhood watch function operates informally but effectively. On the east side of town especially, neighbors recognize unfamiliar vehicles and communicate quickly through neighborhood apps and local Facebook groups. The tight community fabric — something Snohomish has cultivated for decades through its historic identity and small-city events — creates a social layer of deterrence that doesn't show up in any crime index. Several long-term residents describe it as a place where you genuinely know the names of most people on your street within the first year.
The one area worth watching carefully as you choose a specific address: the stretch between the commercial downtown and the Highway 2 on-ramp sees the bulk of the city's vehicle-related theft incidents. Buyers purchasing near the Pilchuck District or close to the 2/9 interchange should factor that in when choosing between comparable properties at different price points. The extra quarter-mile of distance from the commercial core often means a meaningfully different property crime exposure — and that difference matters more in Snohomish than it would in a city with more evenly distributed commercial zones.

Local Expert Takeaway: Buyers who focus on the southeast and east sides of Snohomish — Dutch Hill, Lord Hill, and Highlands East in particular — will find a safety profile that looks nothing like the citywide average. If walkability to downtown is the priority, park smart and lock your car, but don't let the property crime headline scare you away from First Street neighborhoods that offer genuine community and strong long-term value. The crime picture here is overwhelmingly a commercial-zone story, not a residential one.
✅ Violent crime in Snohomish runs well below the national average — roughly 44% lower by FBI estimates, with a zero murder rate in the most recent reporting year. For most residents, personal safety is a genuine non-issue in daily life.
⚠️ Property crime sits above the national average, driven primarily by larceny-theft and vehicle prowls concentrated in the commercial downtown and Highway 2 corridor — not distributed evenly across residential neighborhoods.
📍 The east and southeast sides of the city record the fewest crime incidents annually, with neighborhoods like Dutch Hill, Lord Hill, and Highlands East consistently cited by residents as among the quietest in Snohomish County.
Is Snohomish a safe place to live?
For the vast majority of residents, yes. Snohomish's violent crime rate sits well below both state and national averages, and the neighborhoods that make up most of the residential city — Dutch Hill, Lord Hill, Highlands, Cathcart — see genuinely low incident rates year over year. The elevated property crime average is real but concentrated, and understanding where it clusters helps buyers make smarter decisions about which specific address to choose.
What type of crime is most common in Snohomish?
Property crime — particularly larceny-theft and vehicle prowls — accounts for the large majority of incidents in Snohomish. These tend to cluster around the First Street commercial district and the Highway 2 interchange rather than in residential neighborhoods. Motor vehicle theft and occasional burglary round out the property crime picture, while violent incidents remain comparatively rare.
How does Snohomish compare to Everett for safety?
Snohomish comes out notably safer on both measures. Everett's property crime rate is more than double Snohomish's by most estimates, and its violent crime rate runs roughly twice as high. For buyers deciding between the two cities, Snohomish offers a meaningfully quieter crime environment, though Everett offers a wider range of housing price points. Mill Creek and Maltby post stronger safety numbers than Snohomish, while Monroe comes in as a close peer with slightly higher property crime of its own.
Explore the full Snohomish series: The Ultimate Snohomish Relocation Guide · Is Snohomish Safe? · Cost of Living in Snohomish · Best Neighborhoods in Snohomish · Snohomish Schools & Family Life · Snohomish Youth Sports · Snohomish Parks & Recreation · Retiring in Snohomish · 1031 Tax-Deferred Exchange in Snohomish · Snohomish First-Time Homebuyers Guide · Moving to Snohomish from California
Tell us what you need help with and we'll connect you with local resources.

About the Author
Todd Davidson is the founder of Living in Oregon and Living in Washington, where he publishes in-depth city guides, neighborhood resources, and local market insights covering more than 180 communities across the Pacific Northwest. While his background is in home financing and real estate, he created these digital platforms to help families research and compare regions before making a move.